| Strategic Metric | 2025-2026 Industry Benchmark | FitnessNav Precision Asset Model | Financial & Operational Impact |
|---|---|---|---|
| Global Market Value | Not stated here | Not stated here | Market sizing changes annually and every vendor quotes a different definition of “the ecosystem”. If a market figure is load-bearing in your investment case, buy the underlying report and cite it on the slide |
| Total Cost of Ownership (TCO) | Focus on sticker price (CapEx) | Full Lifecycle Modeling (OpEx focus) | Uncovers 15-20% in “invisible” costs |
| Depreciation & Resale | Accounting treatment is yours to set | We publish neither a depreciation rate nor a resale percentage | What a vendor commits to in writing for parts is checkable; what a buyer pays in year five is not |
| Predictive Maintenance ROI | Reactive Maintenance dominates most facilities | IoT-Driven Proactive Strategy | Measure your own baseline first: unplanned downtime hours per machine per month. No published ROI figure is transferable to your fleet |
| Energy Efficiency (ESG) | High-Consumption (1kW per motor) | Kinetic Harvesting + Solar Integration | Substantial, and highly site-specific. Solar payback depends on your utility rate, roof and local incentive regime — model it from your own kWh bill |
| Revenue Per Sq. Ft. (RevPAS) | Static Cardio Rows | Dynamic Functional Zones | Depends on your members, not the layout. A functional zone raises revenue only if it changes what members buy — measure ancillary spend per visit before and after |
| Asset Residual Value (5-Year) | Not modelled | Not modelled | A retention percentage requires a secondary-market transaction dataset. We do not have one, so we do not print one. Section 3 gives the published warranty terms instead |
Executive Summary: The 2026 Verdict on Precision Assets
In the 2025-2026 global fitness landscape, the definition of equipment has shifted from a depreciating commodity to a “Precision Asset.” As the industry enters the Longevity Economy, fitness hardware is now a critical pillar of preventive healthcare, where AI-driven personalization and wearable integration are treated by vendors as the main growth story. We are not going to rank them as the number one trend for 2026 — that ranking exists in a dozen vendor decks and none of them show their working.
For C-suite executives and institutional investors, the core challenge is no longer just procurement, but the scientific management of the Total Cost of Ownership (TCO). FitnessNav Intelligence identifies that facilities focusing solely on the “sticker price” of equipment inevitably see total costs rise by 15-20% due to invisible expenses such as downtime, energy waste, and rapid technological obsolescence.
The strategic answer for 2026 lies in three pillars: Hardware-as-a-Service (HaaS), IoT-driven Predictive Maintenance, and Brand Equity Optimization. By transitioning from a CapEx-heavy model to an OpEx-based HaaS model, operators can put availability on the dashboard as a number they own — out-of-service hours over scheduled hours, per machine — instead of accepting a vendor’s projected figure.
Furthermore, premium brands like Technogym, Life Fitness, and Matrix publish longer commercial warranty terms than budget equipment, and — this is the part that actually belongs in a financial model — all of them publish non-transferable warranties. A longer warranty caps your catastrophic-loss exposure; it does not tell you what a buyer will pay for the asset in year five, and we are not going to invent that number. Ultimately, the goal is to maximize Revenue Per Available Space (RevPAS), where functional training zones—requiring 70% less space than traditional cardio—generate the highest returns. This report provides the framework to navigate these complexities with insight and execute with confidence.
1. The Longevity Economy: Why Hardware is the New Software
The global fitness market is no longer driven by aesthetics alone. We are not quoting a market value here: the widely circulated figures differ by an order of magnitude depending on whether the source counts facility revenue, equipment sales, or the wider wellness economy, and picking one without naming the definition would be misleading.
- Prescriptive Health: Equipment such as Technogym’s Biostrength™ now uses “Precision Loading” to eliminate trial-and-error, improving documented training results by 30%.
- Medical-Grade Integration: With the rise of “Active Aging,” equipment must support guided, safe, and measurable exercise for rehabilitation and longevity.
- The Connected Ecosystem: Connected gym equipment is the segment every equipment vendor is currently selling into, which makes data interoperability a non-negotiable asset feature. We are not quoting a segment size or a growth rate for it — take those numbers from a named analyst report and check which definition of “connected” it uses, because vendors count a machine with an app as connected and analysts often do not.
2. Deconstructing the TCO Framework: The Iceberg Effect
Total Cost of Ownership is the financial “X-ray” for a facility’s budget, revealing that the purchase price is merely the tip of the iceberg.
The TCO Formula for Fitness Assets
TCO = Acquisition Cost +
n ∑ t=1
( Operating Cost + Maintenance Cost + Hidden Cost ) − Residual Value
- Acquisition & Setup: Includes logistics, customs, and digital integration with existing CRM/Member Apps.
- Operating Costs: Dominated by energy consumption. Traditional motorized treadmills consume ~1,000 watts, whereas modern eco-friendly motors reduce consumption by 22%.
- Hidden Costs: These include “Technical Obsolescence” (software incompatibility) and “Staff Inefficiency” (manual tracking of equipment logs).
- Residual Value: The final cash recovery at the end of the 5-8 year lifecycle. We define it because your model needs the line item; we do not forecast a value for it, for the reasons in Section 3.
3. What We Publish About Depreciation — and What We Refuse To
3.1 What we removed, and why
This section previously carried a five-year residual-value percentage for each brand, plus an annual depreciation rate of 10-12% for premium equipment against 15-25% for budget equipment. None of those numbers had a source. They were our own estimates presented in a table whose column headers implied research. We removed them rather than softening them, because a hedged invented number is still an invented number.
The specific reason we cannot produce them honestly: a year-five retention percentage is a statement about completed secondary-market transactions. It needs a dataset of achieved sale prices, each tied to machine age, usage hours, condition grade and region. FitnessNav does not trade used equipment, has never run a club, and holds no asset-disposal records. Anything we printed in that column would be a guess wearing a percentage sign.
3.2 What is checkable: the published commercial warranty
A warranty term is a contractual commitment with a named publisher behind it. It belongs in a financial model in a way a retention estimate never can — it bounds your exposure on the failure modes that actually end an asset’s life. Here is what each of these brands publishes, transcribed from its own document:
| Brand | Published commercial warranty | Source standing |
| --- | --- | --- |
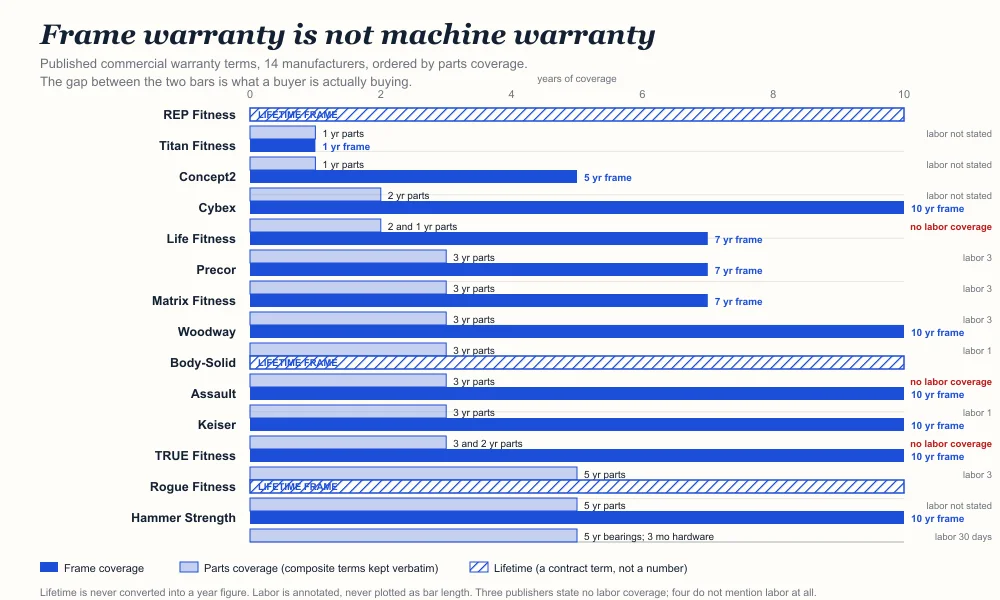
| Life Fitness | 7 years frame · 3 years parts — named “electrical & mechanical”, not enumerated · 3 years labour · motors 7 years · non-transferable | Manufacturer warranty page |
| Matrix Fitness | 7 years frame · 3 years parts — enumerated across motors, electronics, consoles, TVs, pulleys, grips, pedals and bearings · 3 years labour · non-transferable | Manufacturer warranty page |
| Technogym | None on file | We could not retrieve a Technogym commercial warranty document we can cite. Get your distributor’s terms in writing before signing |
| Hammer Strength | None for the equipment this report is about | The only Hammer Strength document we hold covers plate-loaded strength equipment. It is not evidence about a treadmill |
Two things in that table are worth more than any retention percentage we could have printed. First, Life Fitness and Matrix both publish a 7-year frame term and 3-year labour — that is a real, checkable difference in exposure against a brand that publishes nothing citable. Second, every one of these warranties is non-transferable. If your club or your investor sells the asset mid-life, the buyer inherits the machine and none of the remaining cover. That is a concrete, contractual fact about resale, and it is checkable in five minutes by reading the warranty page.
Method note: these four rows are transcriptions, not assessments. We are not scoring the brands, and the table deliberately has no “strategic advantage” column — any ranking we put there would be our editorial opinion sitting in a table that looks like data. For the full comparison of published terms across fourteen manufacturers, see our commercial equipment warranty comparison.
3.3 What to write in the model instead
-
Set salvage to zero and say so in the assumptions. If your lender or investor needs a salvage figure, make them name the source of it — a signed trade-in quote counts, an assumption does not.
-
Carry the warranty labour term as an operating cost line. A 1-year labour term on a 10-year frame means years two through five carry a repair labour assumption that the frame warranty does not cover for you.
-
Price the parts-support risk, not the retention. Ask each vendor in writing how long they supply parts for a discontinued model, whether they publish a parts price list, and whether you can get a diagram to identify a part. Vendors differ enormously here and the answer costs one email.
-
Use a straight-line or double-declining schedule your accountant signs off on. The depreciation rate is an accounting and tax choice, not a brand characteristic. Our earlier table implied brands set it; they do not.
4. Maintenance ROI: From “Fix-it” to “Predict-it”
The transition from reactive to predictive maintenance is the most effective way to protect operating margins.
- The Cost of Reactivity: 75% of maintenance activities in average facilities are reactive, occurring only after failure. This results in emergency repair costs that are 3x-5x higher than planned work.
- The IoT Advantage: By utilizing sensors to monitor vibration, temperature, and motor load, facilities can identify failures 2-4 weeks in advance with 86% accuracy.
- Measure It Yourself: We are not going to print a downtime-reduction percentage or an ROI figure for predictive maintenance. Every vendor we know of publishes one, and none of them will let you audit the denominator — the number always depends on how many machines, how old, and what counts as an outage. Run the measurement on your own fleet: log unplanned downtime hours per machine per month for a quarter before you buy anything, then again after. That is a month of work and it produces a number you can actually defend to an investor.
- Member Retention: Equipment “Out of Order” signs are a visible churn risk during peak hours. Availability is measurable and worth tracking — count out-of-service hours against scheduled hours per machine. We are not attaching a retention-uplift percentage to it, because that would require member-level churn data linked to equipment state, which we do not have.
5. Sustainable Capital: ESG as a Profit Center
In 2026, sustainability is a mechanism for reducing capital costs and boosting brand image.
- Kinetic Energy Harvesting: Modern manual treadmills can generate 50-60 watts per hour. A fleet of 10 treadmills can contribute up to 500 kWh annually to the facility’s grid.
- Solar-Powered Operations: Standard gyms (30k-50k kWh/year) can slash energy costs by up to 70% by integrating commercial solar systems, with a payback period of 5.1-7.1 years.
- Carbon Credits: Advanced protocols (such as ISCC CFC or Gold Standard) are emerging in 2026 to certify carbon removals from energy-harvesting equipment, allowing facilities to monetize their “green” energy.
6. Procurement Strategy: HaaS vs. CapEx
The rise of Hardware-as-a-Service (HaaS) is the defining procurement trend of 2026, shifting equipment from a heavy CapEx burden to a predictable OpEx subscription.
The HaaS Model
For a monthly fee, providers handle installation, automated firmware updates, and proactive repairs. This eliminates “Subscription Fatigue” by bundling hardware with continuous service.
Strategic Sourcing (Kraljic Matrix)
- Strategic Items (AI Cardio): Require long-term partnerships and HaaS to mitigate technology risk.
- Leverage Items (Free Weights): High profit impact but low risk; focus on aggressive price negotiation and volume consolidation.
- Bottleneck Items (Niche Sensors): High risk, low cost; prioritize security of supply over price.
7. Maximizing RevPAS: The Space Optimization Audit
Every square foot of a facility must justify its cost. Static cardio floors are being rebalanced in favor of high-yield zones.
- Functional Training Zones: These pack maximum revenue potential into compact footprints (500-800 sq. ft.). They require 70% less space than cardio sections but increase member retention by 23%.
- Dynamic Layouts: Using “Digital Twin” simulations allows operators to stress-test floor plans before purchasing, reallocating underused cardio rows into strength circuits or recovery nooks to maximize throughput.
- Recovery as Revenue: Dedicating space to assisted stretching, massage tools, and “Intentional Recharge” zones is a growing 2026 trend that opens new ancillary revenue streams.
Conclusion: Executing with Precision
To achieve world-class maintenance and asset performance (defined by 85% OEE and >80% planned work), leaders must treat equipment as a living nervous system, not a static inventory. By aligning TCO modeling, predictive maintenance, and sustainable procurement, the 2026 fitness facility transforms from a “feeling-based business” into a “precision-asset engine.” Combining procurement intelligence with Digital Twin spatial optimization allows for a 15% reduction in square-footage waste, as detailed in the Fitness Asset Intelligence Series.
Disclaimer
This report was prepared by FitnessNav Intelligence for institutional investors, C-suite executives, and professional facility operators. The market projections, depreciation rates, and financial ROI analyses contained herein are based on research data from 2025-2026. Actual results may vary based on global supply chain fluctuations, regional regulatory changes, local utility costs, and brand-specific policy updates. This document does not constitute legal, accounting, tax, or investment advice. Before committing to large-scale asset allocations or HaaS contracts, we recommend consulting with professional financial and legal advisors. All brand comparisons are based on third-party research and public data and do not imply an endorsement by FitnessNav.